On November 18, 2025, Cloudflare experienced a global outage that rippled across its network and impacted millions of requests per second. The cause was not an attack, a memory leak, or a bad rollout. It was something far more subtle: a database permissions change that caused a key metadata query to return duplicate rows.
That duplicate set of records doubled the size of an internal feature file, which then propagated across their global network. The growing file breached a memory limit, crashed proxies, and created oscillating 5xx errors as different nodes generated conflicting versions of the file.
Critical failures increasingly originate in the data layer, where traditional observability has the weakest coverage. This is exactly the kind of incident where Database Activity Monitoring (DAM) proves its value, not as a compliance checkbox, but as a real-time signal layer that accelerates debugging when failures begin in the database.
To be clear, we do not know which internal tools Cloudflare uses. Treat this as an illustrative example of how DAM-style signals can shorten the investigation path in a similar incident.
The Cloudflare outage: a data-layer root cause
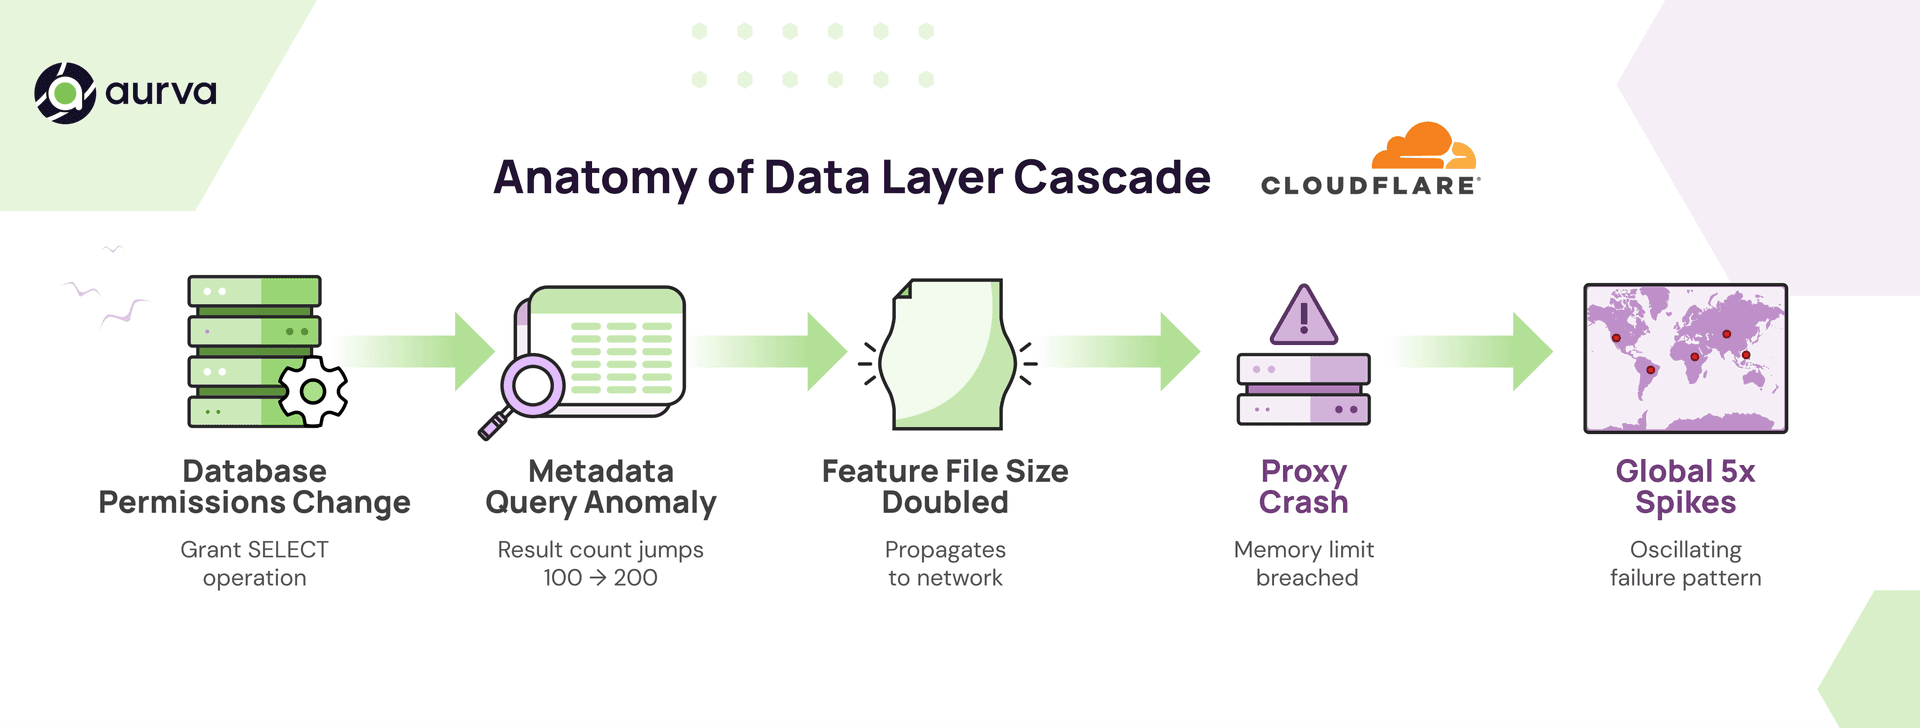
If you distil the incident, the chain looks like this:
- A permissions change affected access to a database table (
system.columns). - This caused a query to return duplicate metadata rows.
- The downstream job that generated a Bot Management feature file interpreted the duplicates as new features.
- The feature file doubled in size and propagated across the network.
- Several workers hit memory limits, crashed, and began returning widespread 5xx errors.
- Because file generation ran every 5 minutes and produced inconsistent results between nodes, the failure pattern oscillated and became harder to diagnose.
This is a textbook example of why database visibility is not just a security requirement. It is an operational necessity.
What is DAM, in operational terms
Database Activity Monitoring (DAM) is a category of tools and infrastructure that continuously monitor activity inside your databases:
- Which users and services access what data
- What queries execute and what row counts they return
- When permissions change
- How access patterns evolve over time
You can think of it as a real-time visibility layer for your data. It is built to surface anomalies and misconfigurations before they cascade into something larger.
Unlike native database logs, which are engine specific, often incomplete, and sometimes mutable, DAM systems operate independently. They standardize and secure the audit trail while providing real-time alerting and anomaly detection.
Traditional debugging vs DAM-aware debugging
Without DAM, the investigation usually starts at the edges of the system.
A typical path looks like this:
- A global outage is detected as 5xx errors spike across regions.
- Teams dig into proxy crashes and memory limit alarms.
- They notice an oversized feature file being regenerated every few minutes.
- They trace that file back to a metadata job and eventually to a query that is suddenly returning duplicate rows.
- Only then do they uncover the permissions change that caused the query to behave differently.
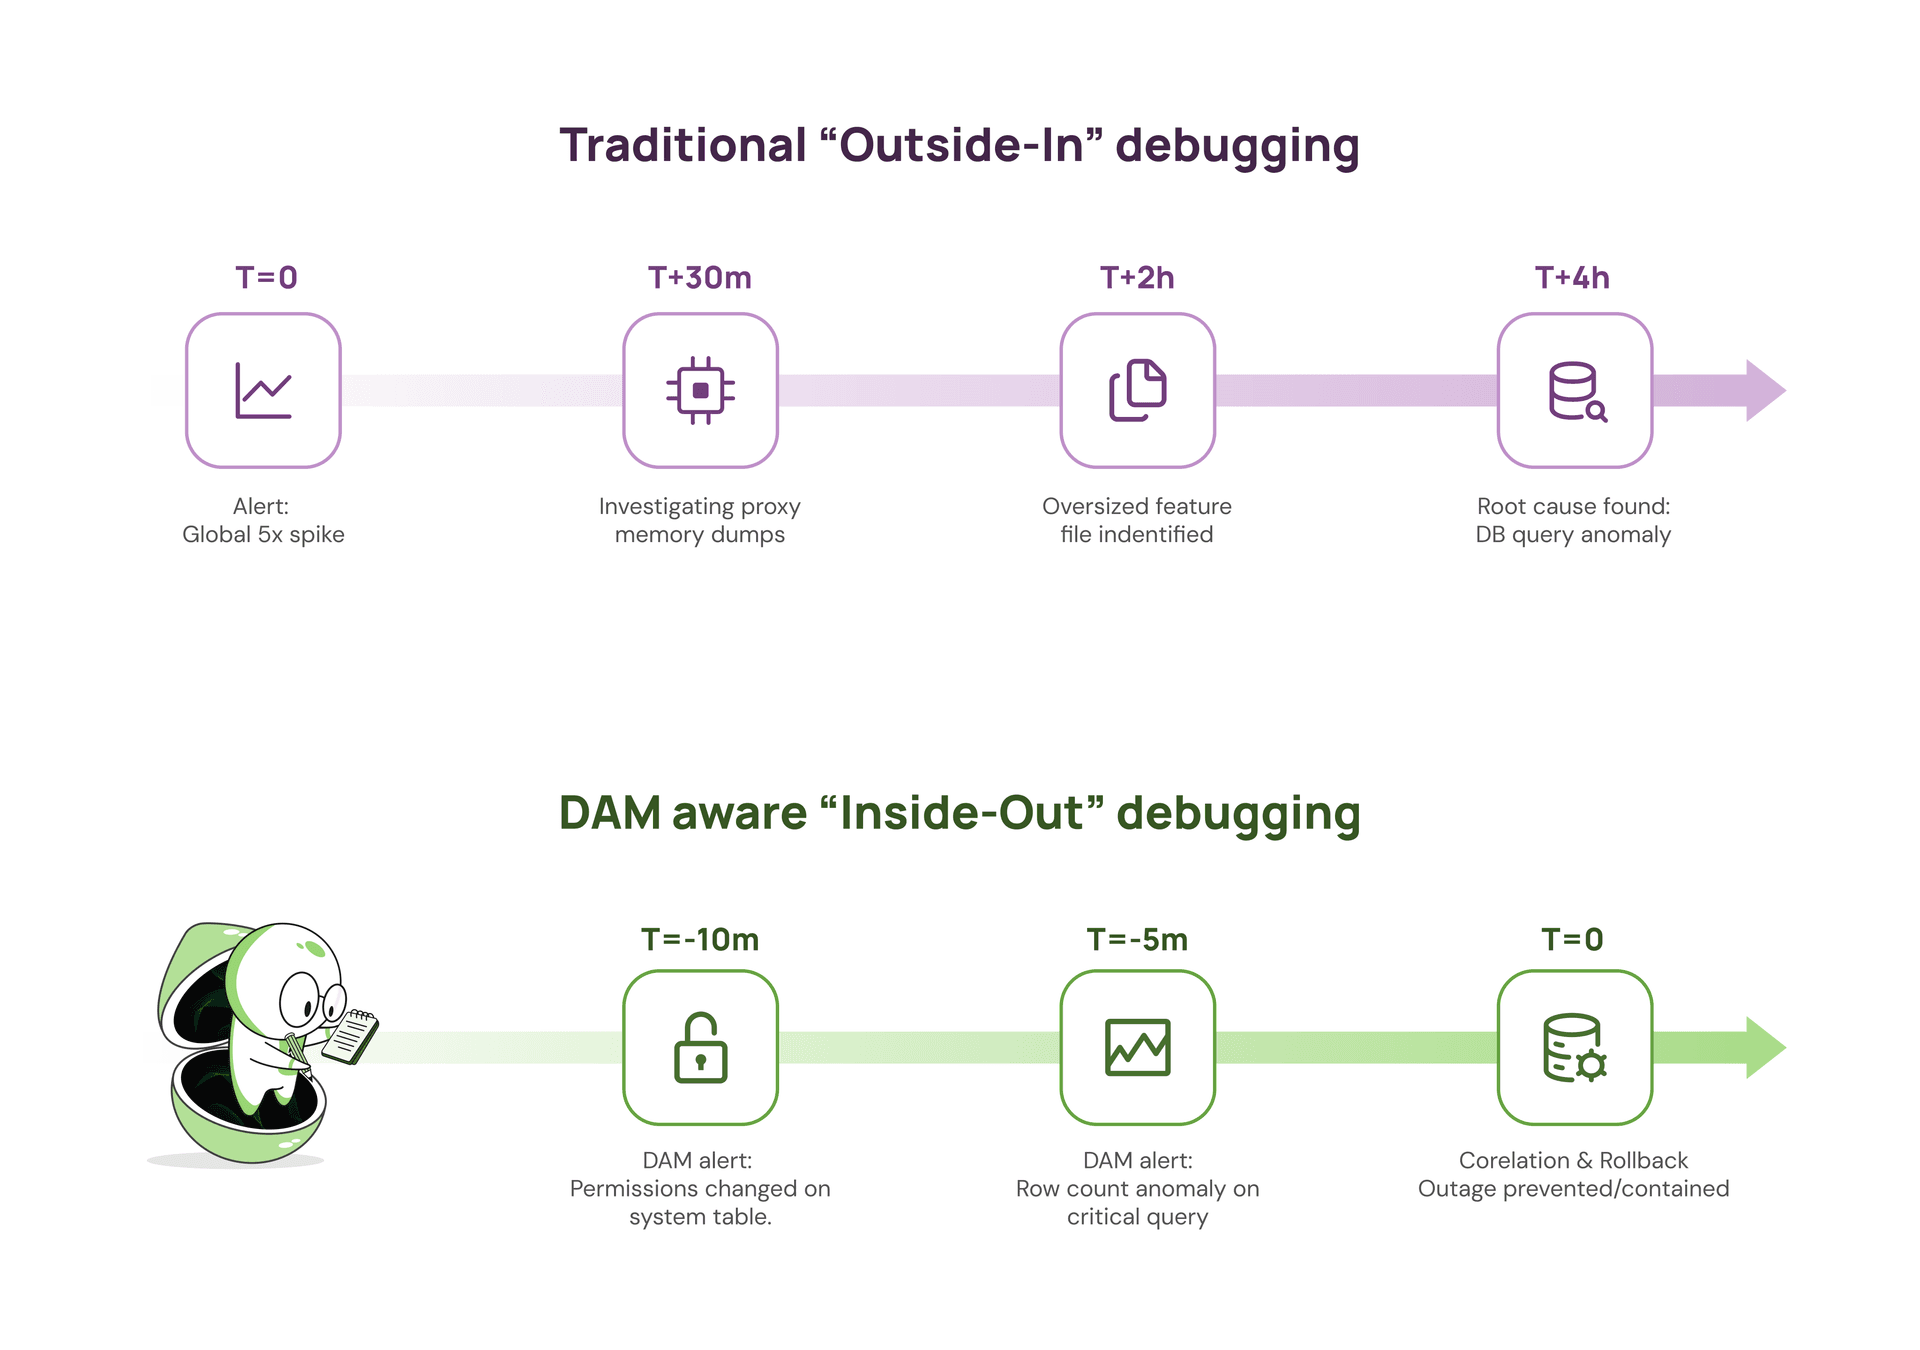
With DAM in place, the first clues look very different:
- Alert: Row count anomaly for the metadata query that powers the feature file.
- Alert: Permissions change on the critical
system.columns table a few minutes earlier.
Correlate those two signals and you are at the real root cause before the oversized feature file has propagated widely enough to take down proxies or generate large waves of 5xx responses.
The key difference is not just minutes versus hours. It is whether you discover the problem while it is still a contained data issue, or after it has turned into a full network wide incident.
How DAM would have changed the debugging path
Two specific DAM capabilities stand out as difference makers in a scenario like this.
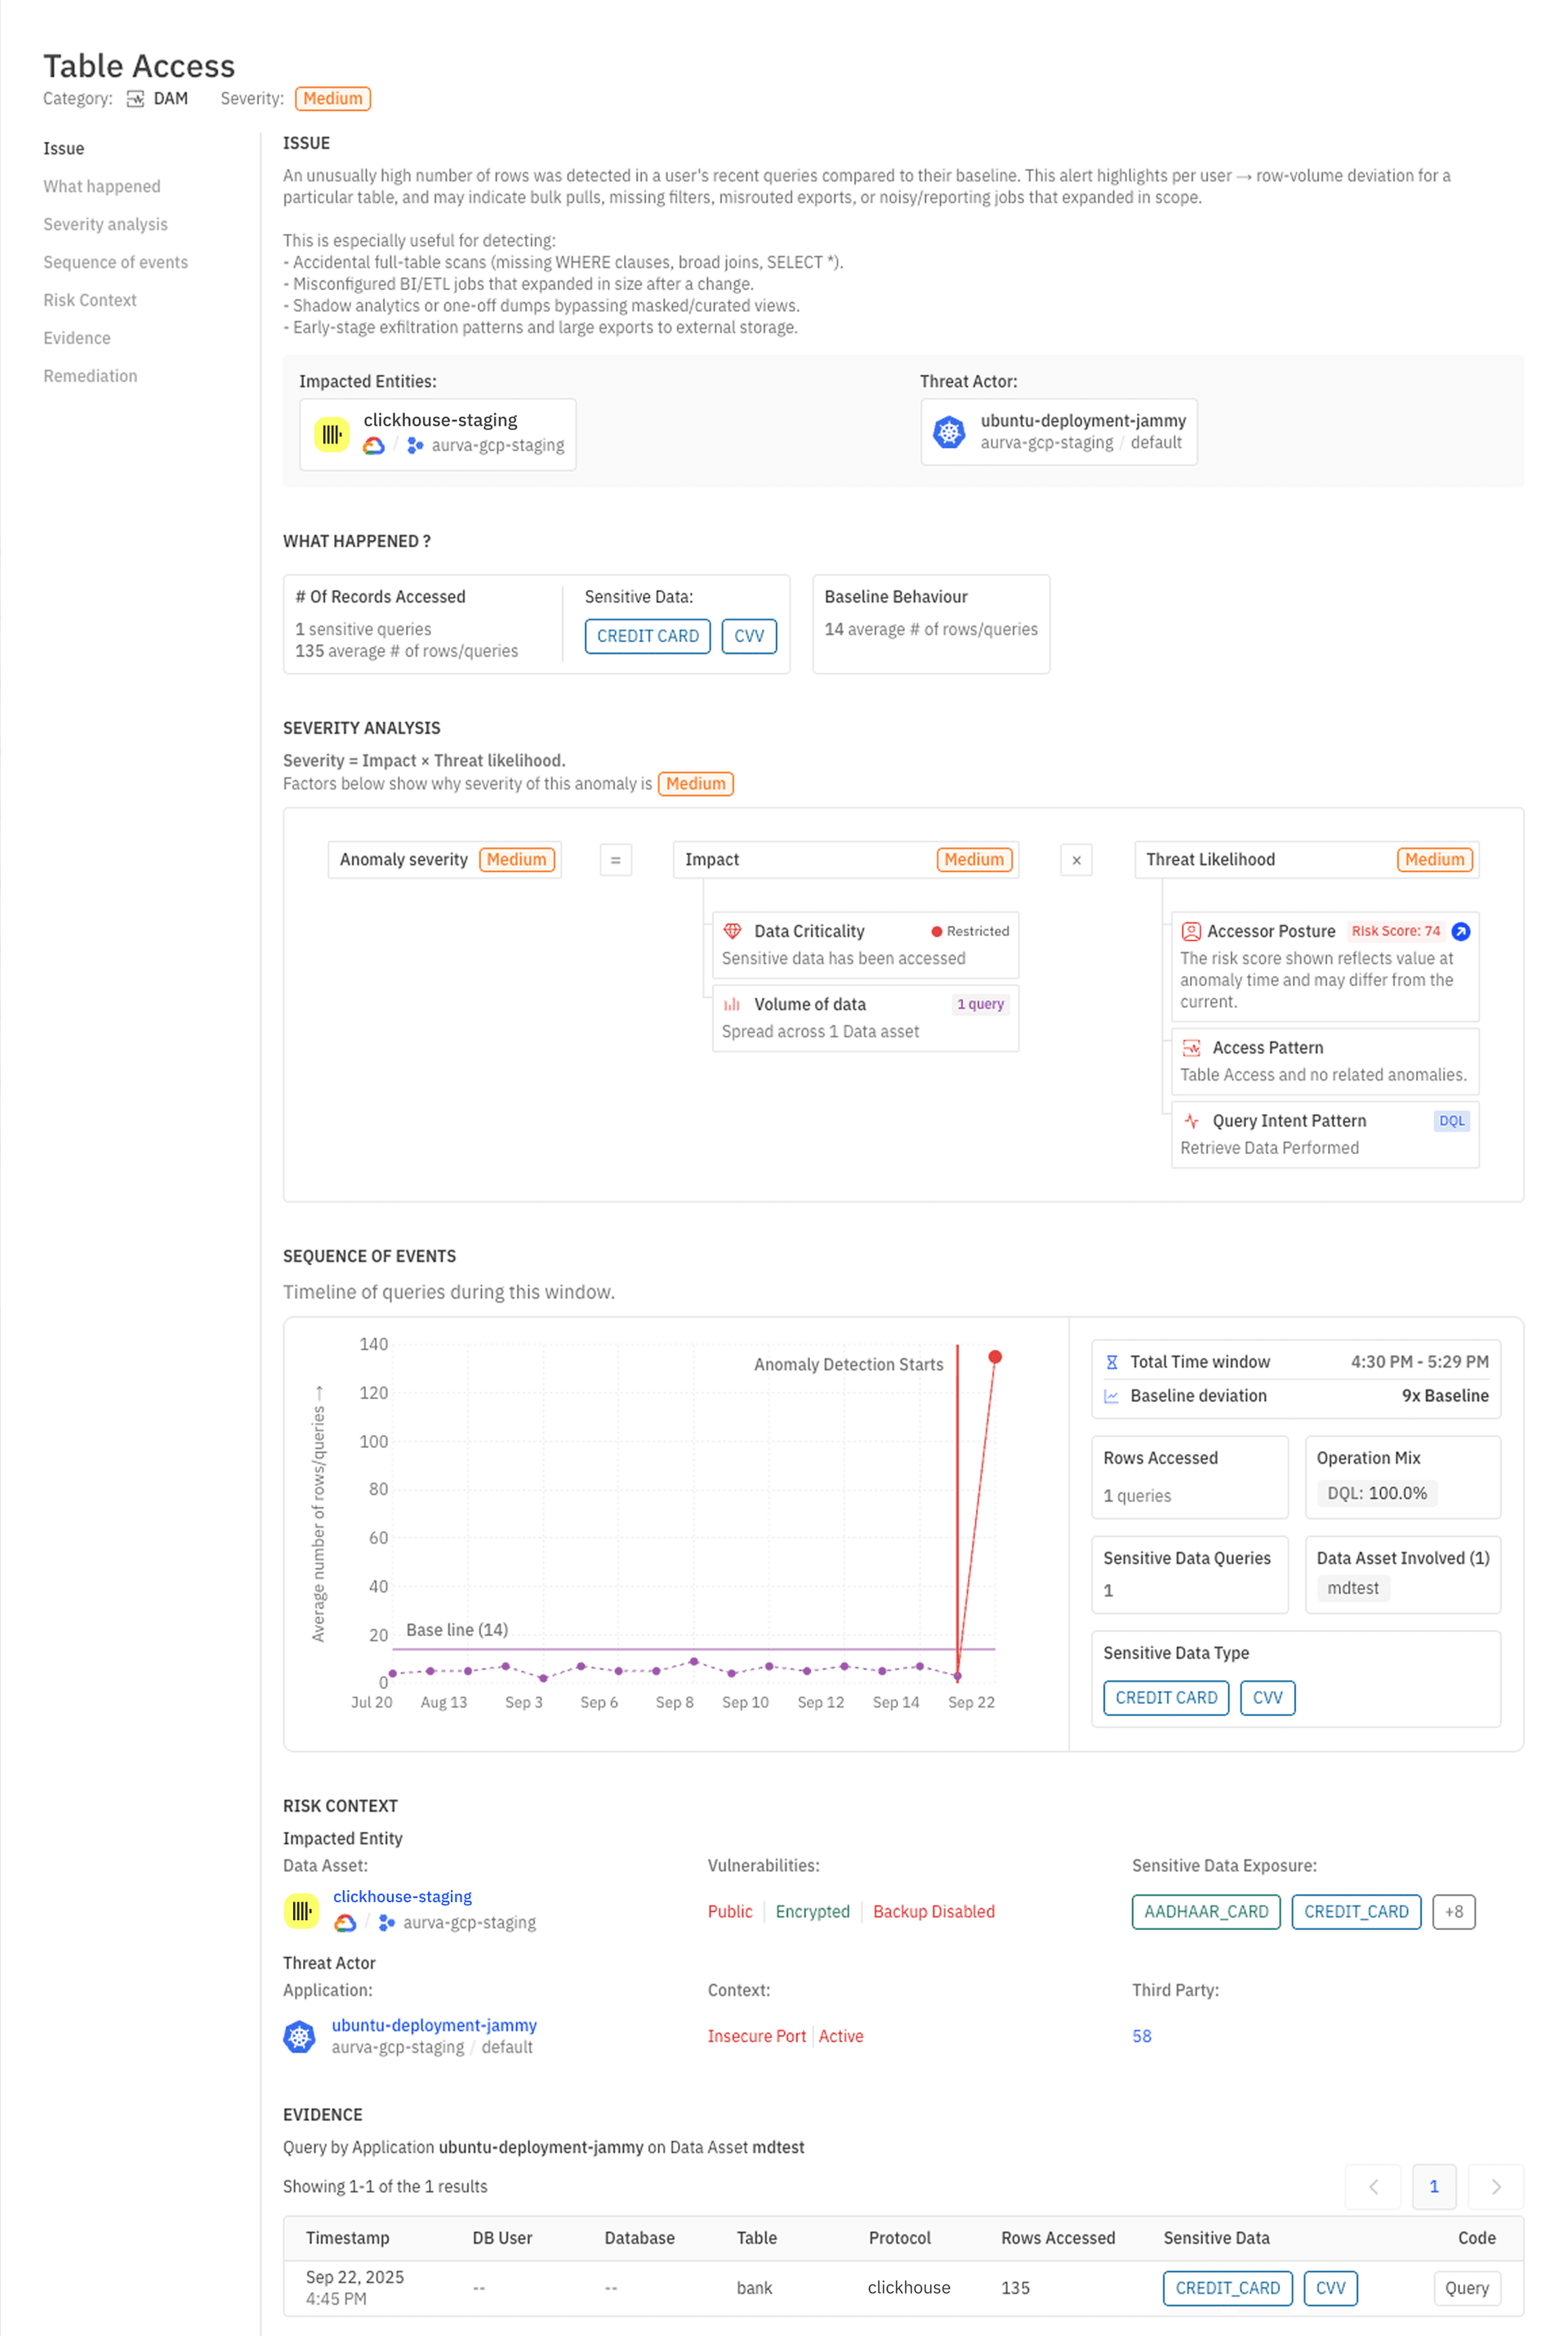
1. Anomaly detection on query results
Traditional monitoring often alerts on static thresholds, like “alert if row count is greater than 1000”. DAM anomaly detection learns the normal baseline of how many rows each critical query usually returns and alerts when something materially deviates.
In an outage like this:
- Metadata queries are expected to be extremely stable.
- The moment duplicates appeared, and the row count jumped, an anomaly detector would have fired.
An on-call engineer would have seen:
- The exact query whose behaviour changed
- The user or service executing that query
- The deviation from the baseline row count
That is exactly the sort of early signal you want before downstream jobs start generating oversized files and crashing proxies.
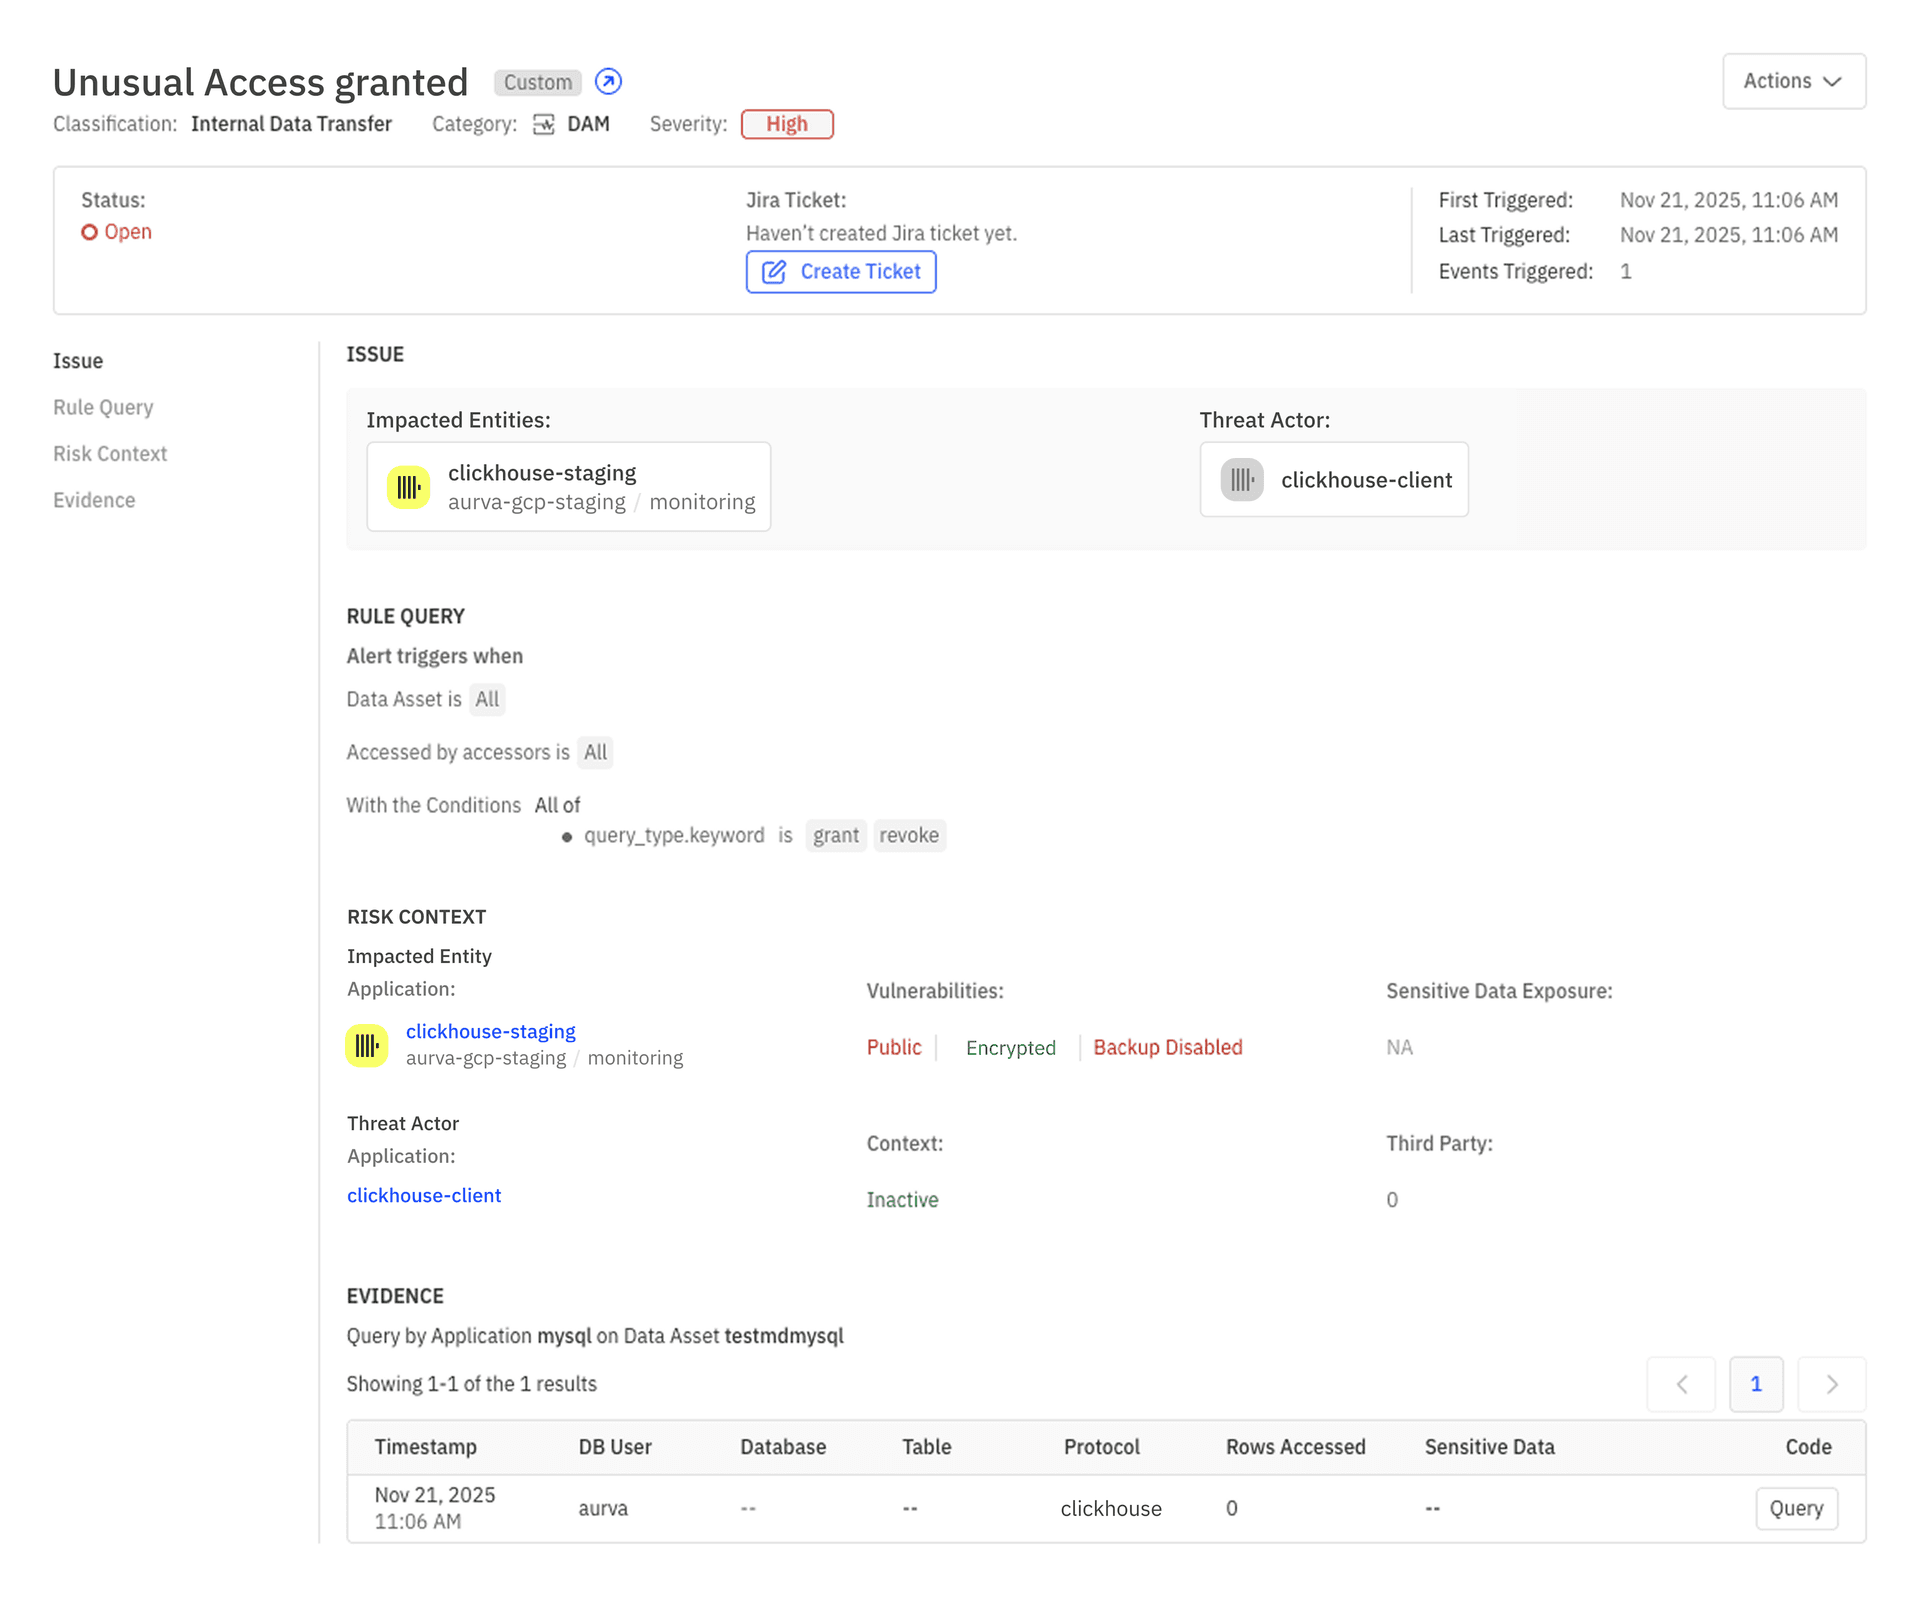
2. Permission change monitoring on critical tables
The initiating event in this outage was a permissions change.
DAM tools continuously monitor:
- GRANT and REVOKE operations
- Role and group modifications
- Privilege escalations
- Changes to access on critical tables or schemas
A DAM system could have produced an alert like:
- Alert: User access change detected
- Operation: GRANT SELECT ON
system.columns TO role_x - Impact radius: downstream jobs that rely on table metadata
- Timestamp: 10 minutes before first 5xx error spike
On its own, a GRANT might not look urgent. Lined up next to a row count anomaly on a dependent query, it becomes a very strong lead.
Combined: the on-call engineer’s shortcut
Now imagine you are the on-call engineer, looking at your incident dashboard.
Within a short window you see two DAM signals:
- “The
system.columns metadata query for the feature generation job is returning roughly 2x its normal row count." - “SELECT privileges on
system.columns were granted to role_x 10 minutes ago."
You immediately have a working theory: a recent permission change altered what this metadata query can see, and that change is now propagating into downstream feature generation.
Instead of starting from 5xx graphs and heap dumps on edge proxies, you start from the data layer and work forwards:
- Reproduce the metadata query and confirm the duplicate rows.
- Roll back or correct the permission change.
- Regenerate a clean feature file and redeploy it. </aside>
In many cases you can do this before the bad file has fully rolled out or before the impact grows from partial errors into a global outage.
DAM does not magically prevent every incident, but it gives you a direct, high-quality signal at the place where this incident began: the database.
The path forward
You can run without DAM. Many organizations still do.
But as more systems rely on database driven features, configuration, and decisions, the cost of losing visibility into the data layer keeps rising. Outages that look like “proxy crashes” on the surface are increasingly rooted in subtle changes deep in the database.
If you want observability that is data aware and resilient to failures that begin at the query and permissions level, DAM is the missing piece.


